React Dashboard User Guide
Pattern Vault provides a stunning, glassmorphic multi-pane dashboard built with React 19, Vite, TypeScript, TailwindCSS, Zustand, and TanStack Query.
This guide details the core panels and how to navigate the user interface.
Dashboard Layout
The dashboard is structured into a dynamic CSS Grid containing collapsible side navigation and a series of dedicated workspace panels.
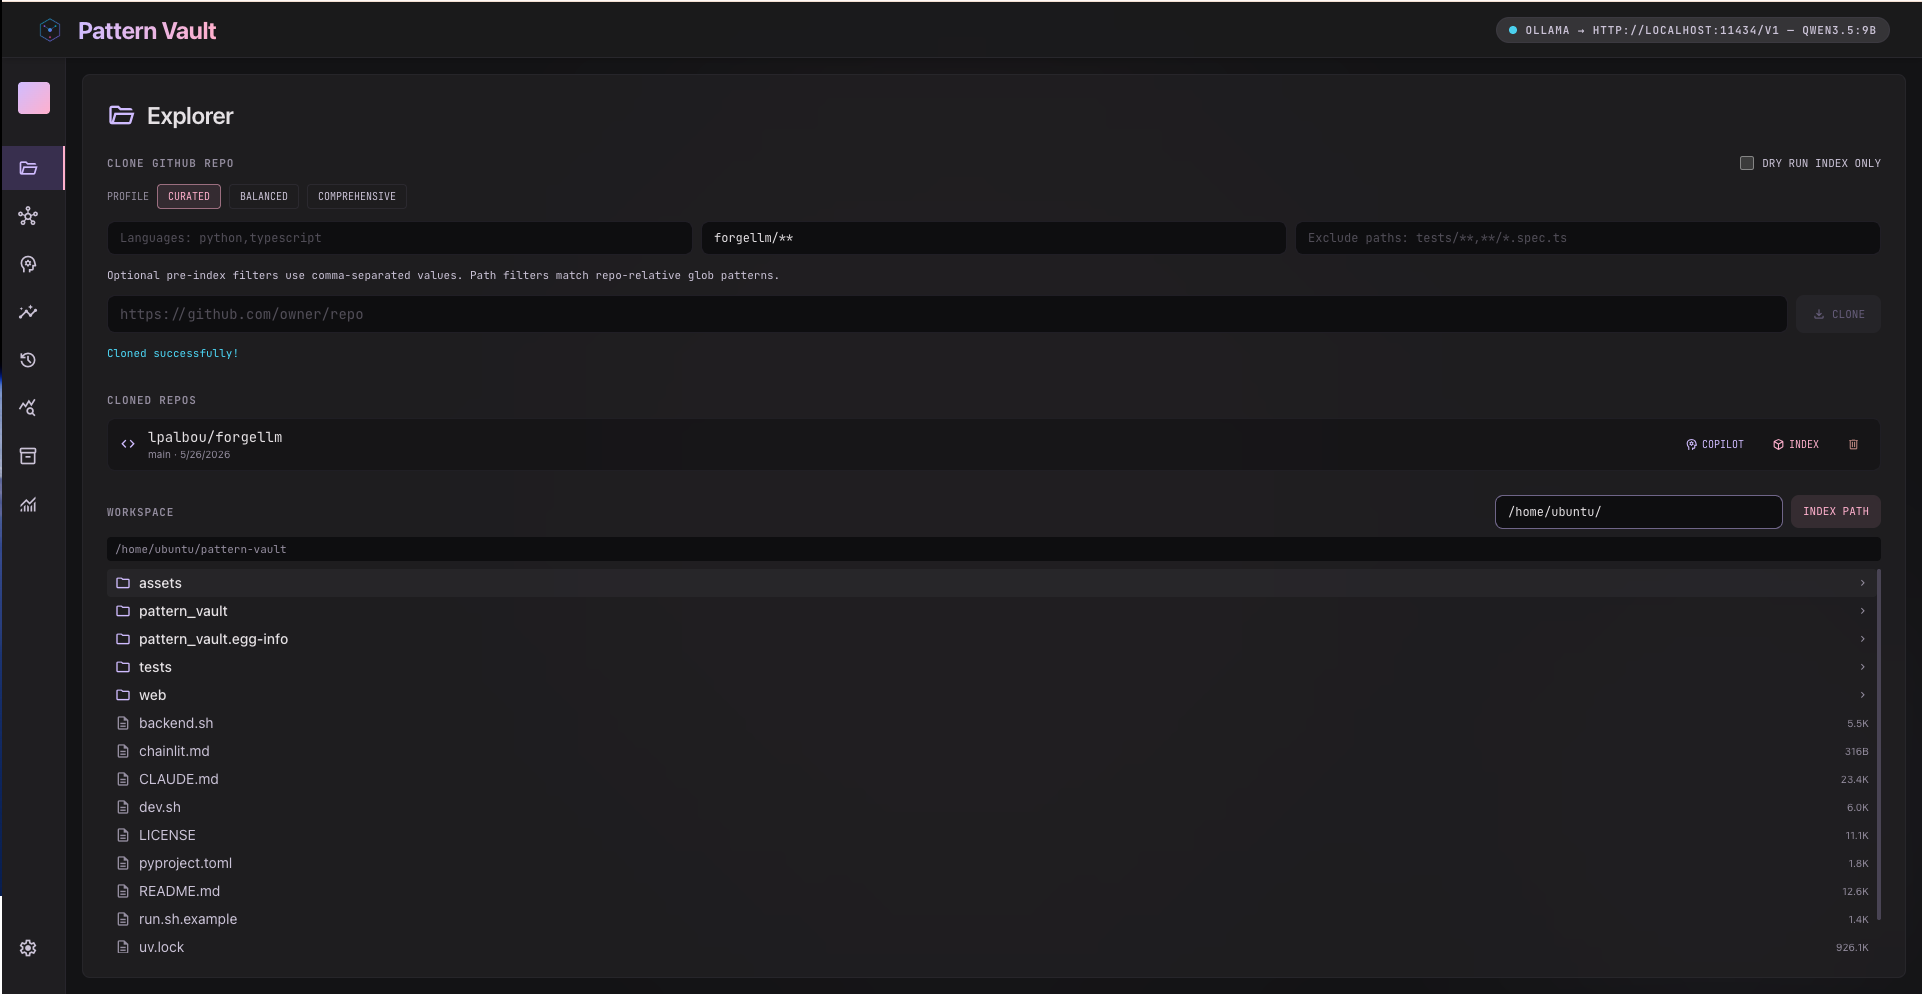
Core Panels Guide
1. Vault Panel (Overview Metrics)
The command center of your database: - System Indicators: View the status of the selected LLM backend (e.g., Anthropic, AWS Bedrock, Ollama) and the absolute path to your active SQLite database. - Statistical Cards: At-a-glance counters showing total indexed patterns, code chunks, and repo insights. - Distribution Charts: Visual breakdowns of patterns categorized by programming language and engineering types. - Active Tags: An interactive cloud of tags. Clicking a tag instantly redirects you to the Browser panel filtered by that tag.
2. Browser Panel (Pattern Explorer)
Browse and inspect stored patterns:
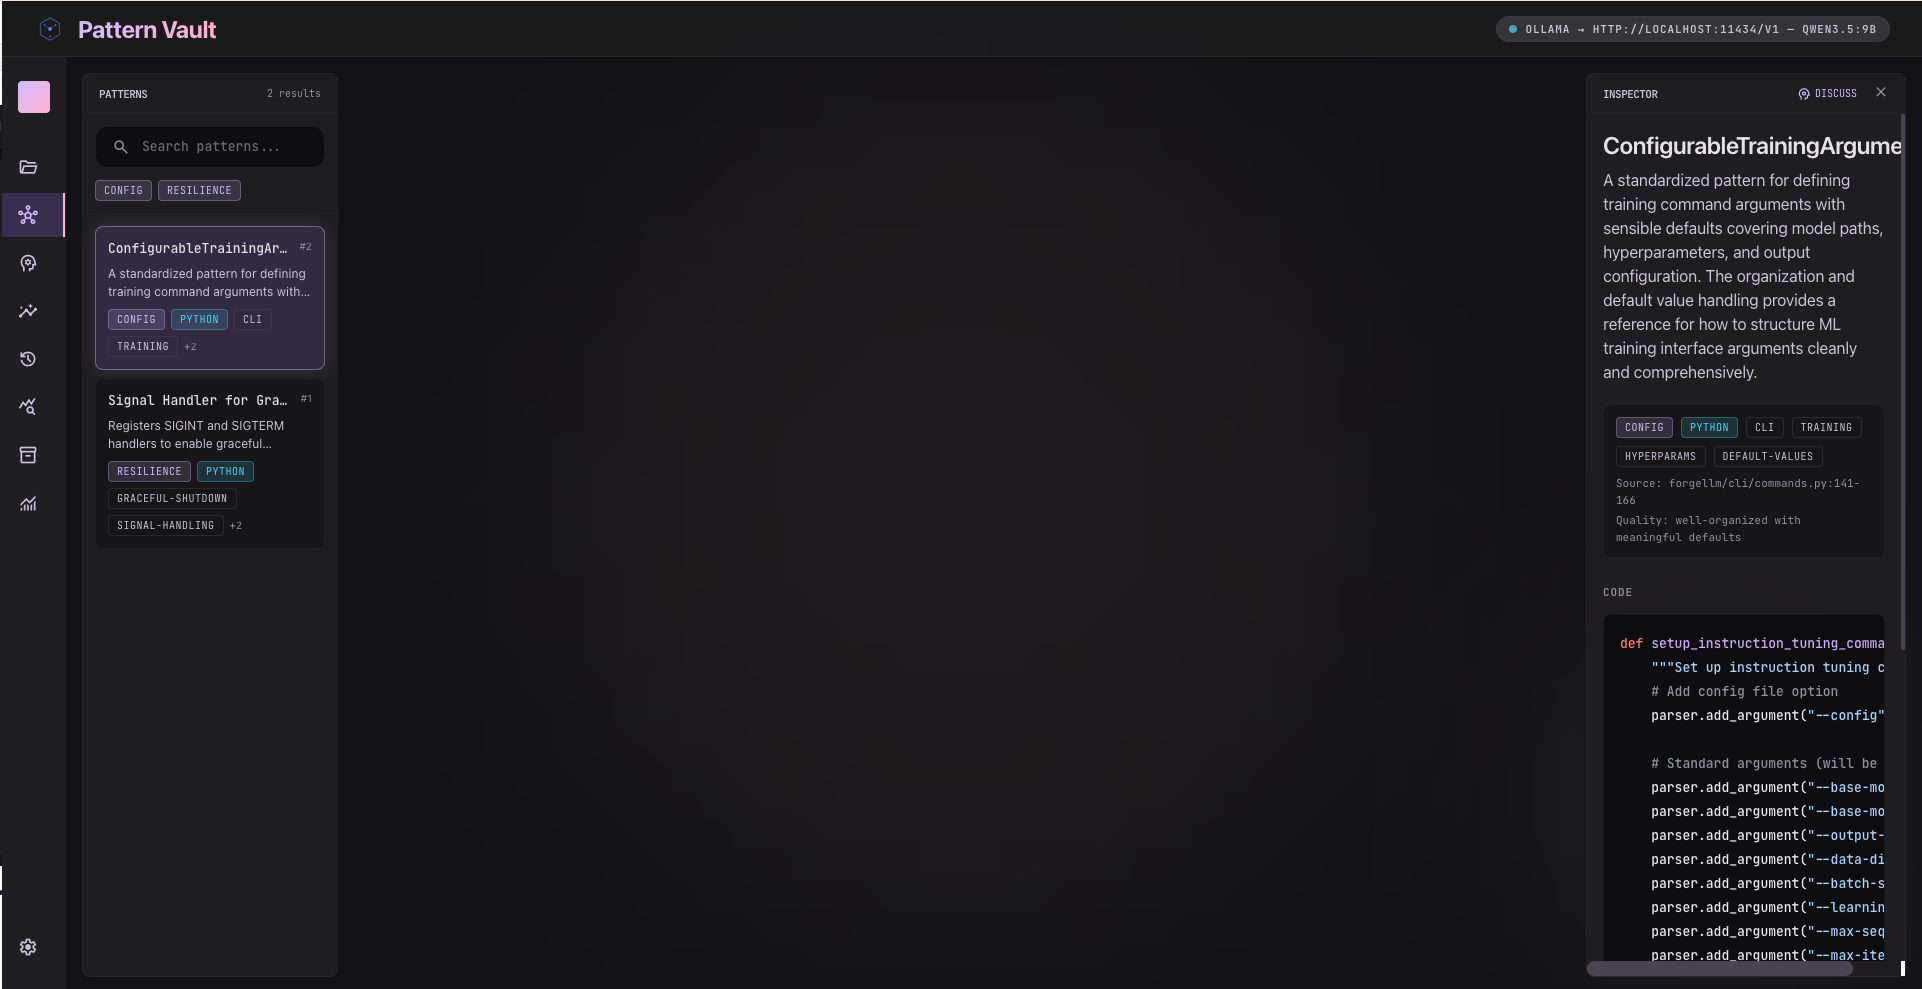
- Faceted Filters: Search patterns by raw text and filter by category (e.g., resilience, api_pattern) or programming language (e.g., python, typescript).
- Logical Inspector: Clicking a pattern reveals its metadata details, extraction quality score, source repository location, line numbers, and the full syntax-highlighted source code.
3. Ingestion Panel (Workspace Indexer)
Run and track indexing jobs:
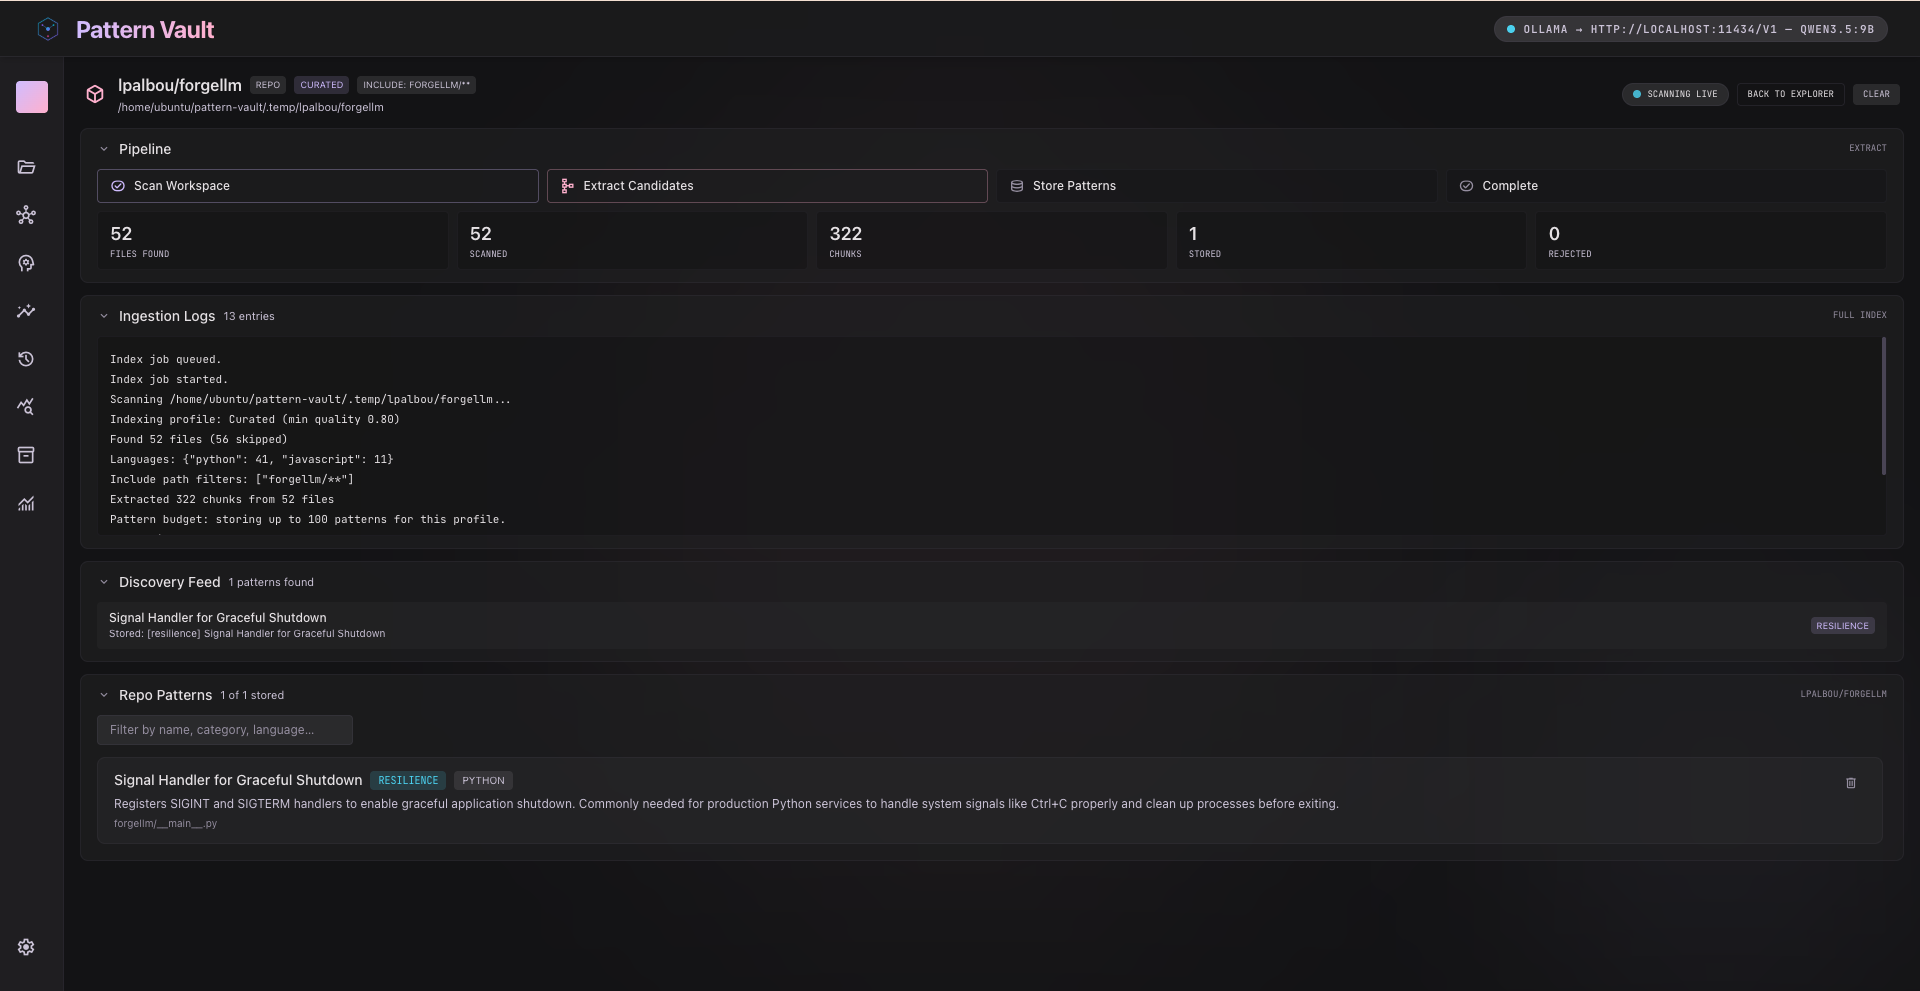
- Trigger Ingestion: Input a local workspace path, specify path exclusions, choose a profile (curated, balanced, comprehensive), and launch a batch indexing job.
- Job History: View list of all past ingestion jobs with statuses (running, completed, failed) and execution timestamps.
- Stream Log Console: Click a job to view real-time, replayable step-by-step logs of the chunker and LLM extraction process.
4. Chat Panel (Agent Loop Interface)
Interact with the dynamic orchestrator agent:
- SSE Text Streaming: Engage in natural language conversation with the agent.
- Interactive Tool-Steps: The UI displays nested, accordion-style steps showing exactly what the agent is doing in real-time (e.g., scan_directory, read_file, parse_symbols).
- Confirmation Hooks: When the agent wants to save a newly extracted pattern, it prompts you in the chat interface before committing write operations.
5. Usage Panel (Token Expenditure)
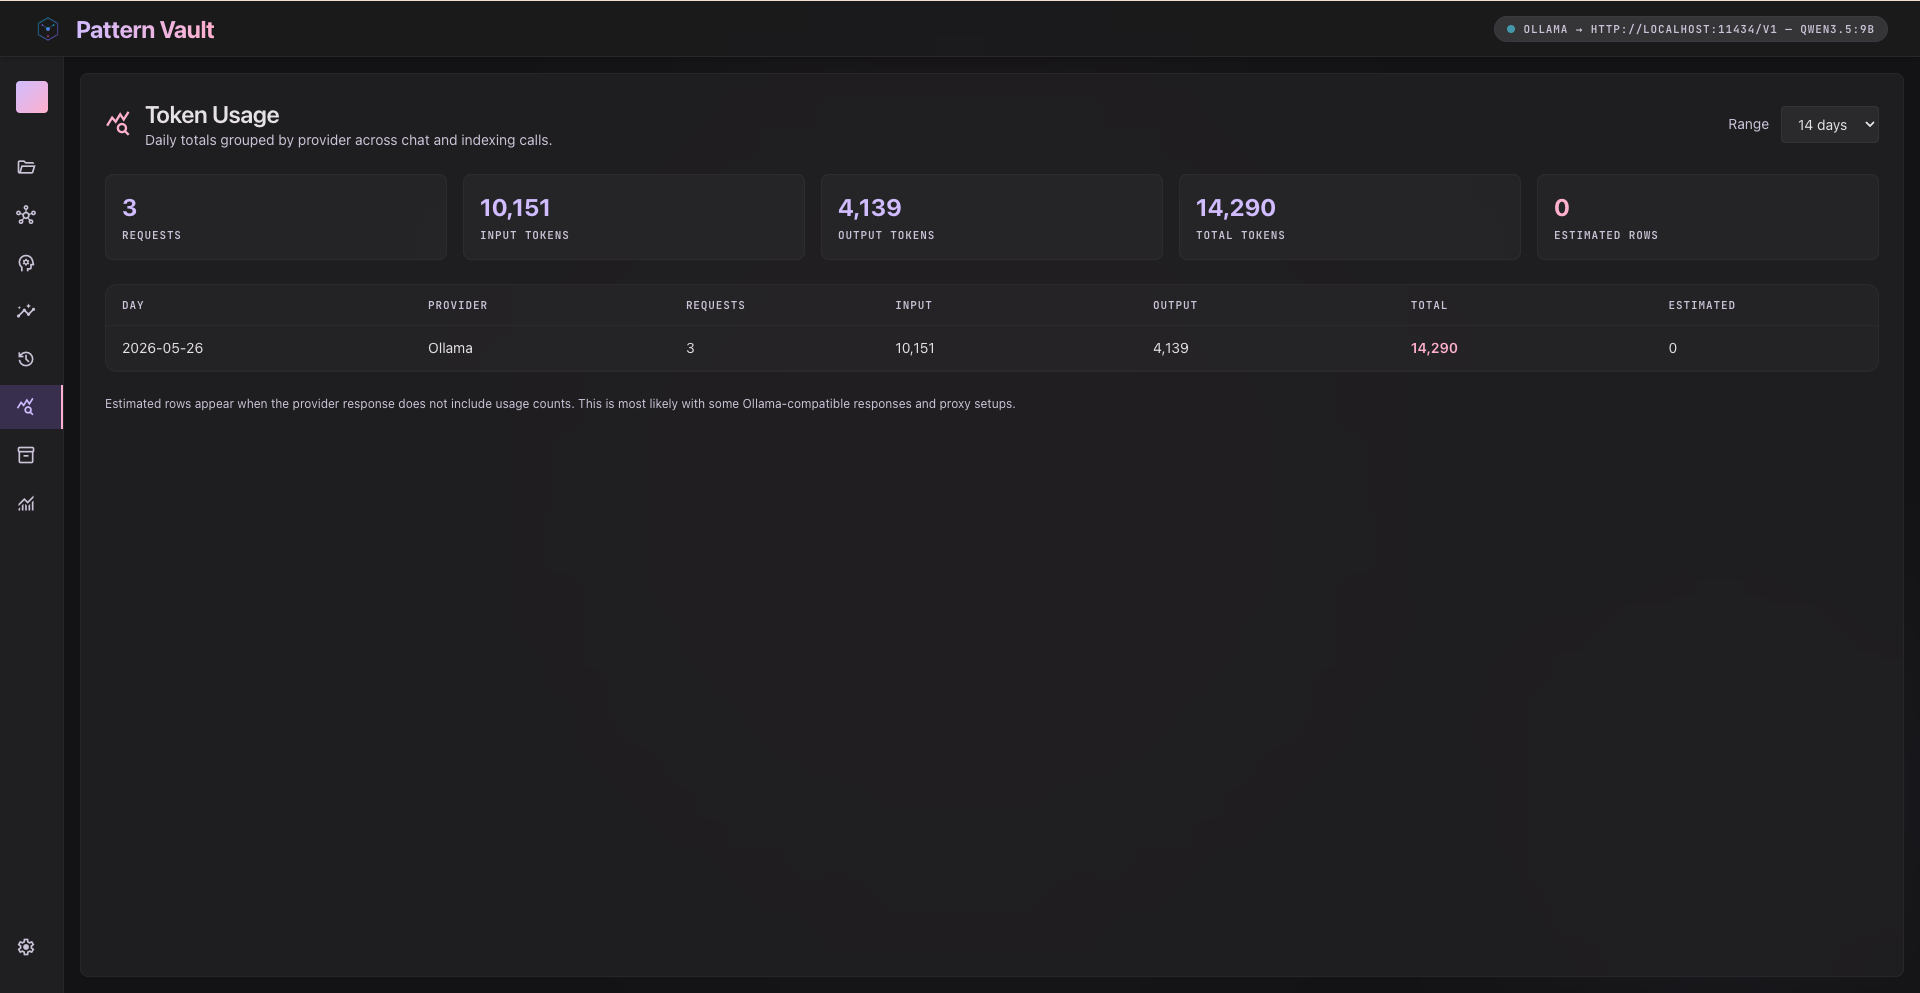
Keep control of model expenses: - Token Event Log: Displays an event log of API calls including input tokens, output tokens, model version, and estimation costs. - Aggregation Charts: Sums up total token expenditures by session ID, backend provider, and execution pipeline.
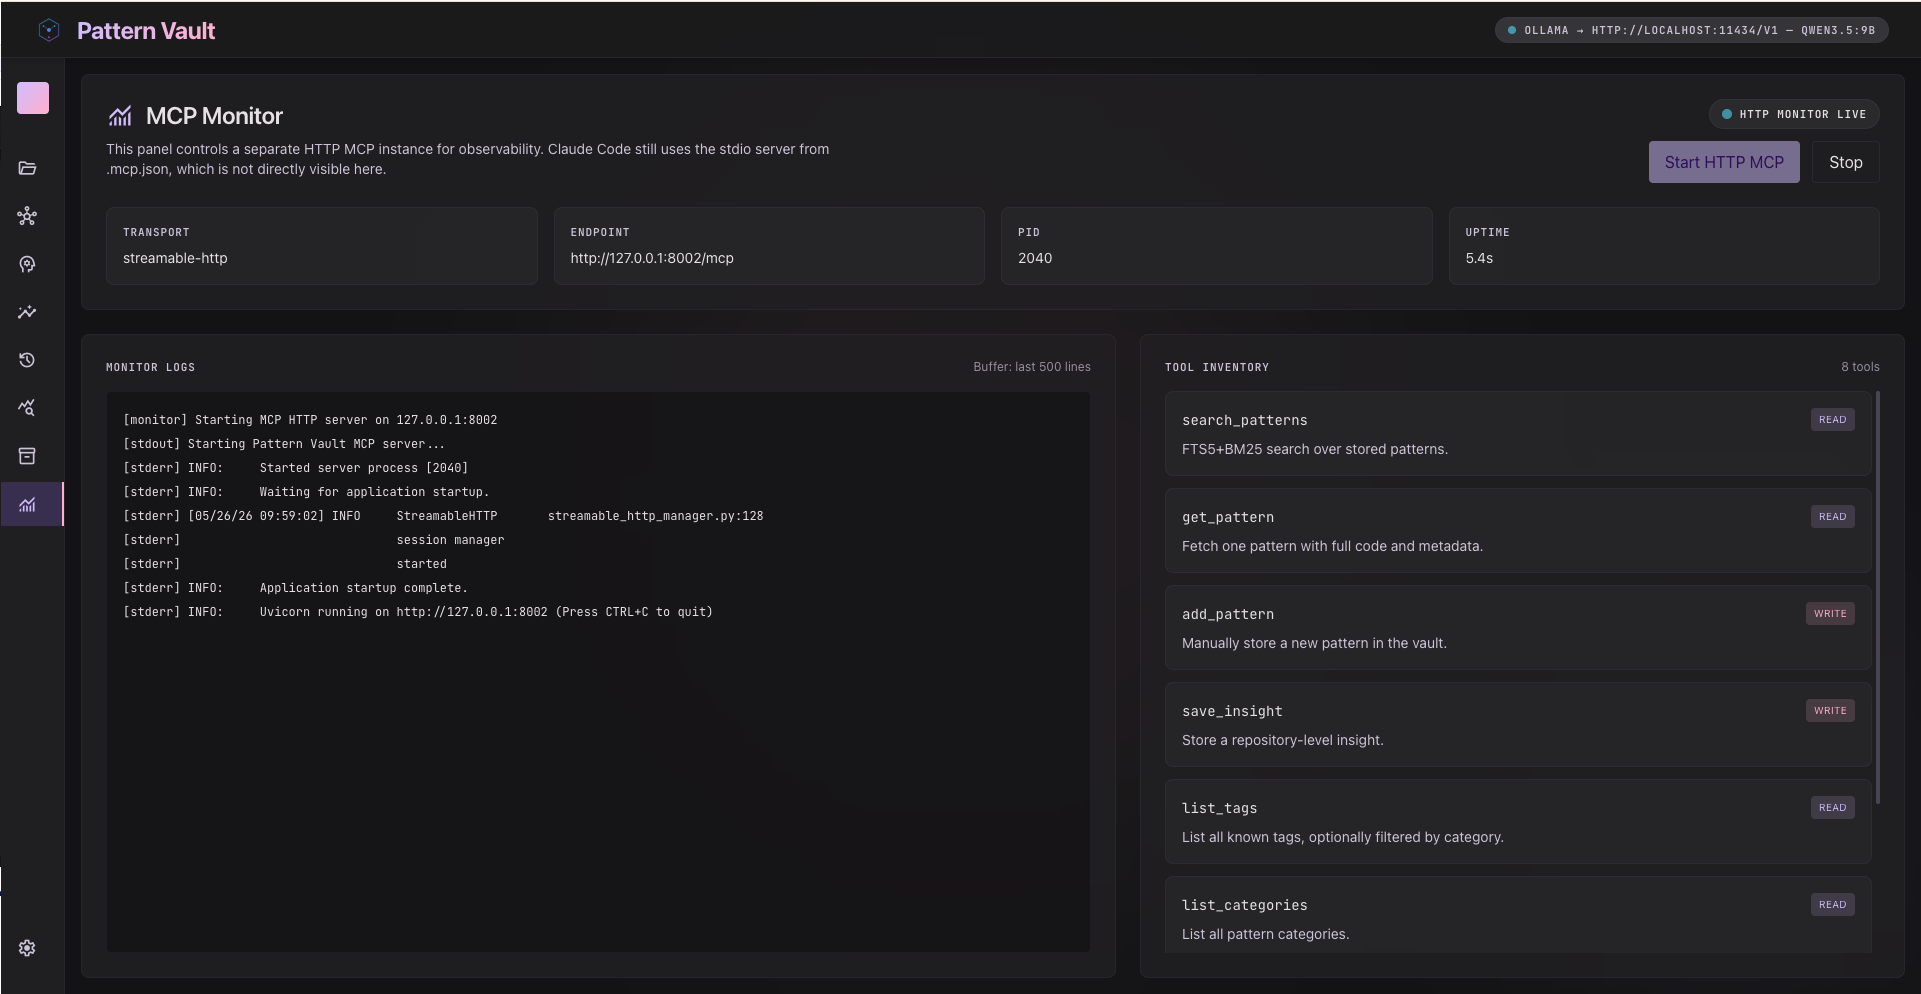
6. MCP Panel (HTTP Server Monitor)
Manage your IDE connection directly:
- Allows starting, restarting, or shutting down the dedicated HTTP-based Model Context Protocol (MCP) server process.
- Provides configuration defaults, server status indicator, connection URL (http://127.0.0.1:8002/mcp), and connection configurations for your IDE.
Local Development Lifecycle
To start developing or customising the React dashboard, you can launch the servers via our unified helper script:
# Start FastAPI (8001) and Vite (5173) in background
./dev.sh start
How the Port Proxy Works
- The FastAPI backend BFF exposes JSON endpoints on
http://127.0.0.1:8001. - The Vite frontend dev server runs on
http://127.0.0.1:5173. - To avoid Cross-Origin Resource Sharing (CORS) errors during development,
web/vite.config.tsincorporates a reverse proxy. Any client-side request prefixed with/apiis automatically routed behind-the-scenes to the FastAPI server:
// web/vite.config.ts snippet
server: {
  proxy: {
    '/api': {
      target: 'http://127.0.0.1:8001',
      changeOrigin: true,
    }
  }
}